
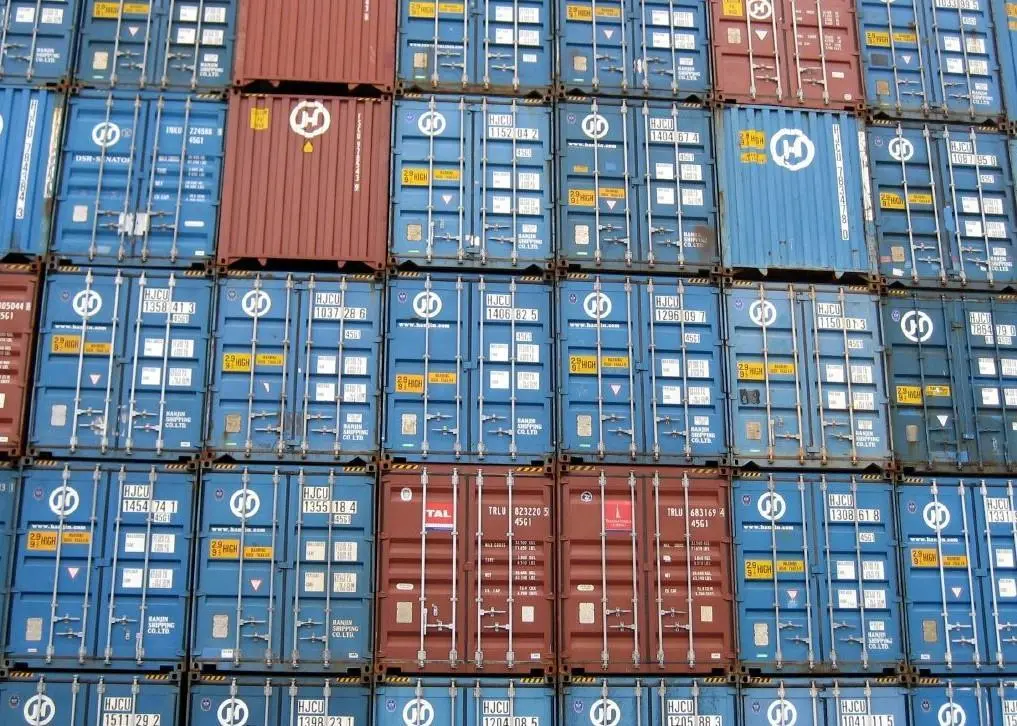
🛳️ 𝗚𝗹𝗼𝗯𝗮𝗹 𝗰𝗼𝗻𝘁𝗮𝗶𝗻𝗲𝗿 𝘃𝗼𝗹𝘂𝗺𝗲𝘀 𝗵𝗶𝘁 𝗿𝗲𝗰𝗼𝗿𝗱 𝗵𝗶𝗴𝗵 🛳️
Global container throughput reached an all‑time monthly high in July 2026, even as freight rates climbed and key routes stayed disrupted. For Australian importers and exporters, that combination of record volumes and elevated pricing is showing up in tighter space, rolling cargo, and more volatile schedules across our main Asia–Australia lanes.
𝘛𝘩𝘦 𝘨𝘭𝘰𝘣𝘢𝘭 𝘱𝘪𝘤𝘵𝘶𝘳𝘦 𝘪𝘯 𝘱𝘭𝘢𝘪𝘯 𝘯𝘶𝘮𝘣𝘦𝘳𝘴…
• July 2026 global lift: 17.3 millionTEU, a new monthly record, about 25,000 TEU above the previous high in May.
• Year‑to‑date volumes: Up 5.1% vs the same period in 2025; July alone up 4.5% year on year.
• Freight price index: Global Price Index at 115 points, the highest since August 2024, up roughly 47% since the start of 2026 and 37% above July 2025.
• Trade flows: Far East exports up almost 9%, driving growth to every destination region.
• Sub‑Saharan Africa imports up 14% YTD; Europe imports up 6.1%.portstrategy
• Indian Sub‑Continent & Middle East the only region with an import decline, down 4.2%.portstrategy
In short: demand is strong, but disruption (Gulf Crisis, tariff shifts, oil prices, Panama Canal constraints) is keeping capacity tight and rates elevated.
Australia doesn’t sit in the biggest trade lanes by volume, but we feel the knock‑on effects hard.
• Capacity competition: When Far East exporters push record volumes to Europe and the US, carriers prioritise those higher‑yielding lanes. That leaves fewer slots and more volatility on secondary routes like Asia–Australia.
• Rate pressure: Global rate strength feeds into our lanes. Recent data shows Asia–Australia mean rates around USD5,900/FEU depending on origin, with carriers announcing rate restorations from mid‑September and 1st October.
• Reliability risk: Congestion and delays in Southeast Asia and North/East Asia are already being cited as drivers of “bouncing” rates and schedule unreliability into Australia and New Zealand.
Even if your cargo isn’t going via the Gulf or Panama, you’re competing for the same boxes, vessels, and port windows in a system running hot.
𝘞𝘩𝘢𝘵 𝘵𝘩𝘪𝘴 𝘭𝘰𝘰𝘬𝘴 𝘭𝘪𝘬𝘦 𝘰𝘯 𝘵𝘩𝘦 𝘨𝘳𝘰𝘶𝘯𝘥 𝘧𝘰𝘳 𝘈𝘶𝘴𝘵𝘳𝘢𝘭𝘪𝘢𝘯 𝘧𝘰𝘳𝘸𝘢𝘳𝘥𝘦𝘳𝘴 𝘢𝘯𝘥 𝘴𝘩𝘪𝘱𝘱𝘦𝘳𝘴
If you’re booking out of Australia right now, you’re likely seeing:
• Tighter space on peak weeks, especially for 40’ HQ and reefer equipment.
• More rolling and transhipment delays, particularly via SE Asian hubs.
• Carriers pushing GRI/restore announcements with short notice windows.
• Higher all‑in costs as base rates, peak season surcharges, and equipment fees stack up.
At the same time, rail gains at Port Botany and Fremantle show the network is adapting, but landside capacity only helps if ocean legs are reliable.
📸 and reference https://www.portstrategy.com/news/news/global-container-volumes-hit-record-high/