
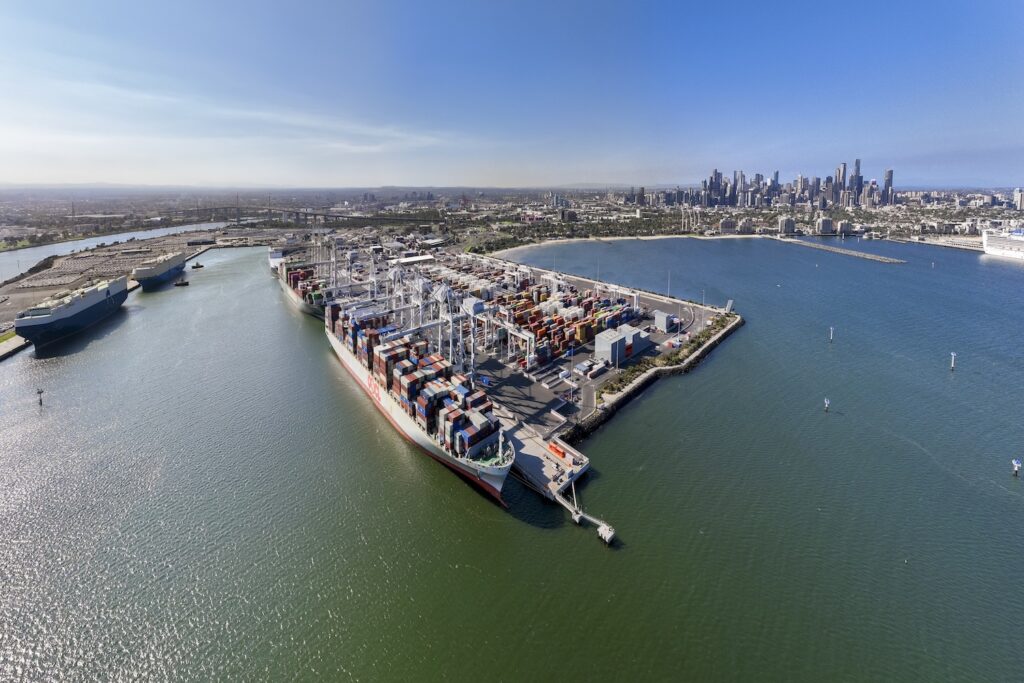
🛳️ 𝙋𝙤𝙧𝙩 𝙤𝙛 𝙈𝙚𝙡𝙗𝙤𝙪𝙧𝙣𝙚 𝙥𝙤𝙨𝙩𝙚𝙙 𝙧𝙚𝙘𝙤𝙧𝙙 𝙮𝙚𝙖𝙧 𝙞𝙣 𝙘𝙤𝙣𝙩𝙖𝙞𝙣𝙚𝙧 𝙫𝙤𝙡𝙪𝙢𝙚𝙨 🛳️
Australia’s largest container port has done it again.
In FY2026 (July 2025–June 2026), the Port of Melbourne handled a record 3.52 million TEU, up 3.8% on the previous year’s record of 3.39 million TEU. That’s the second consecutive financial year of record throughput, reinforcing Melbourne’s position as the country’s busiest container gateway and a critical node for south‑east Australia trade.
The port also reported a record trade value of around $171 billion for the year, underlining how much national import/export activity flows through this single facility.
Key themes from the Trade in Review FY2026 report include:
• 𝗜𝗻𝗱𝘂𝘀𝘁𝗿𝗶𝗮𝗹 𝗮𝗻𝗱 𝗰𝗼𝗻𝘀𝘁𝗿𝘂𝗰𝘁𝗶𝗼𝗻 𝗶𝗺𝗽𝗼𝗿𝘁𝘀 𝗴𝗮𝗶𝗻𝗶𝗻𝗴 𝗺𝗼𝗺𝗲𝗻𝘁𝘂𝗺
Alongside steady consumer goods, the port saw stronger volumes of industrial and building materials, including commodities like cement and gypsum signalling continued investment in infrastructure, warehousing, and manufacturing capacity in Victoria.
• 𝗗𝗶𝘃𝗲𝗿𝘀𝗶𝗳𝗶𝗲𝗱 𝗲𝘅𝗽𝗼𝗿𝘁 𝗯𝗮𝘀𝗲 𝗵𝗼𝗹𝗱𝗶𝗻𝗴 𝘂𝗽
Agricultural exports remained a backbone, with notable growth in beef, paper/paperboard, and scrap metal, helping offset softer volumes in crops like cotton and wheat. This mix matters for reefer, dry, and breakbulk planners who balance seasonal peaks across different commodity lines.
• 𝗔𝘂𝘁𝗼𝗺𝗼𝘁𝗶𝘃𝗲 𝘁𝗿𝗮𝗱𝗲 𝗿𝗲𝗼𝗿𝗶𝗲𝗻𝘁𝗶𝗻𝗴 𝘁𝗼𝘄𝗮𝗿𝗱𝘀 𝗖𝗵𝗶𝗻𝗮
In a structural shift, China overtook Japan as the largest source of imported motor vehicles through Melbourne in FY2026. Over the past six years, China’s share of vehicle imports rose from about 1% (FY2020) to 28% (FY2026).
• 𝗥𝗲𝘀𝗶𝗹𝗶𝗲𝗻𝗰𝗲 𝘁𝗵𝗿𝗼𝘂𝗴𝗵 𝗴𝗹𝗼𝗯𝗮𝗹 𝗱𝗶𝘀𝗿𝘂𝗽𝘁𝗶𝗼𝗻
The result came despite ongoing geopolitical uncertainty, including US tariff policy shifts and supply‑chain impacts linked to instability around the Strait of Hormuz. Fuel supply chains adjusted sourcing patterns, while export demand stayed broadly diversified.
Melbourne’s record cements its long‑held lead in containerised trade…
• 𝗠𝗲𝗹𝗯𝗼𝘂𝗿𝗻𝗲: ~3.52 million TEU (FY2025/26), up 3.8%
• 𝗣𝗼𝗿𝘁 𝗕𝗼𝘁𝗮𝗻𝘆 (𝗦𝘆𝗱𝗻𝗲𝘆): around 2.8 million TEU in recent annual data, with about 19% rail share for NSW container
• 𝗕𝗿𝗶𝘀𝗯𝗮𝗻𝗲: roughly 1.62 million TEU (FY2024/25 record), with trade valued at about $73.5 billion
While bulk ports like Port Hedland dominate by tonnage, Melbourne remains the clear leader by container volume and a primary barometer for Australian consumer and industrial demand.
📸 and reference Port of Melbourne